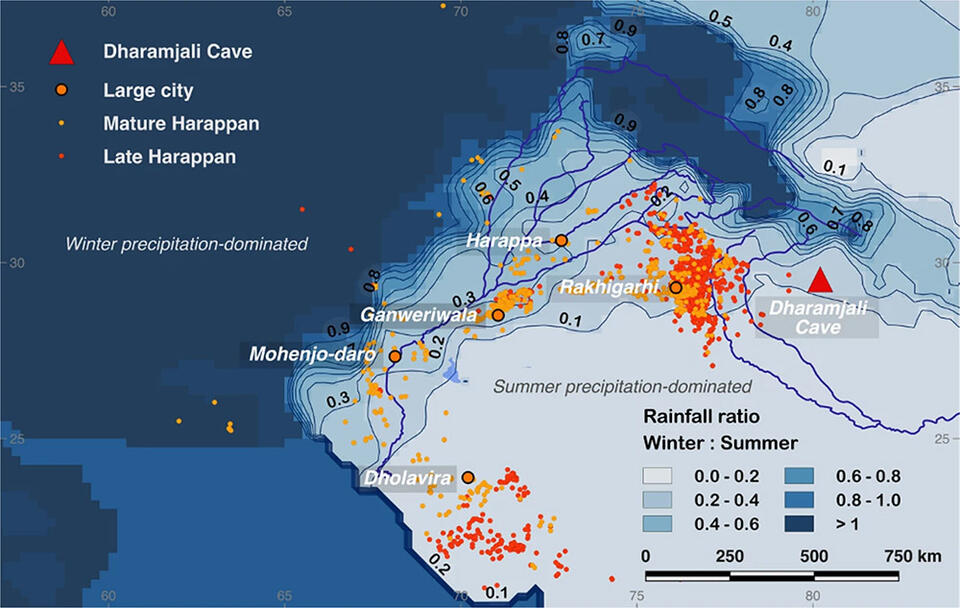
This highly technical and scientific paper brings together all the recent evidence from Dharamjali Cave in the Himalayas over a 230 year period around 2000 BCE, when the ancient Indus civilization was in decline, to show "that repeated intensely dry periods spanned multiple generations. The record highlights the deficits in winter and summer rainfall during the urban phase of the Indus Civilization, which prompted adaptation through flexible, self- reliant, and drought-resistant agricultural strategies."
The larger Indus basin is unusual in that winter rainfall is also important, if not equivalent to summer rainfall in the western fringes (see Figure 1 above), and together with snow melt plays a role in permitting agricultural options that seem to have helped facilitate the growth of civilizations in the region during Indus times and earlier. The discovery of a stalagmite inside Dharamjali Cave (location above) has allowed scientists to reconstruct in great detail over a longer period winter monsoon effects in addition to summer ones, over a period that covers the apparent decline of Indus cities, which "reveals three distinct dry periods lasting 25–90 years each, which correspond to the general timing of the ‘4.2ka event’" (p. 5). We can only imagine how serious an agricultural civilization with cities whose populations were in the tens of thousands, even a hundred or two hundred thousand, would have experienced such lengthy changes in rainfall, but it seems to have led to a migration of peoples into the North Indian Gangetic plain. As the many authors state in a section on cultural implications, "the high resolution of the DHAR-1 record advances our understanding by revealing at least three major dry periods within this period lasting 25–90 years each. Since the 4.2 ka event is significant in part because of its impact on large, complex Bronze Age civilizations, DHAR-1’s level of temporal resolution is applicable to the human decision-making timescale. While farmers and traders may be able to temporarily adjust practices in the face of a multi-year drought, a severe multi-decadal dry period affecting several generations of people would prompt more far-reaching and permanent adaptations or even population movement—particularly after the peak of the final and longest 90-year drought by 4.02 ka BP," (p. 6).
The authors continue: "Moreover, the adverse effects of droughts on rainfed and floodplain agriculture would have been amplified if both rainfall seasons weakened or failed entirely. These periods of lower rainfall are particularly long in human timescales, and would have impacted multiple generations of individual populations and influenced their subsistence practices. The diversity of crops and farming practices of some populations of the Indus Civilization made them more resilient to such changes." In other words, we know that people in different Indus settlements were able to adapt and store water for example, so that effects varied in different areas, but there can be little doubt that changes in rainfall played some role in the decline of Indus cities. This evidence suggests it probably was substantial even if more work needs to be done to examine effects on the ground in detail.
Another important implication of this paper is that climate change can have major effects, as we are seeing today in the region with whole areas of Iran bordering Pakistan literally drying up, and people from the Middle East and elsewhere on the move as their own neighborhoods become unlivable or unable to sustain their populations with food and water. Unfortunately the prognosis for modern South Asia – indeed the whole Asian continent – is dire given present warming trajectories, and this paper is one more piece in the historical evidence that climate can have enormous effects on civilization. The difference is that today we are well aware of our contribution, and doing far too little about it. It is unlikely that Bronze Age populations had that degree of responsibility or choice.
Figure 1: Large Indus cities are labeled and shown with the site distribution during the Mature Harappan (c. 4.6–3.9 ka BP, orange) and Late Harappan (c. 3.9–3.6 ka BP, red) periods. Contour lines represent the ratio of IWM (Nov–Apr) to ISM (May–Oct) precipitation based on the 0.25° GPCC v2018 dataset from 1951–2000 rain gauge data

