The map in Figure 1 shows the distribution of 5 x 5 m collection units and 71 quadrats (the larger units shown) that were the basis for selecting a system of random sampling within each quadrat, thus providing a maximum coverage of the entire mound. Within each 5 x 5 m unit we weighed and counted all surface artifacts, including ceramic sherds, fired clay nodules and terracotta cakes, and small fragments of undifferentiated fired clay debris (e.g., bits of nodules, cakes, etc.). Recording of materials in the individual units demonstrated the dense coverage of artifact remains at the site on all three mounds. Sherd counts, for example, in the south mound included 3,754; in the Central mound, 2,611; and in the north mound, 2,093. In sum, 12,452 diagnostic ceramic sherds and 3,506 small finds were recorded.

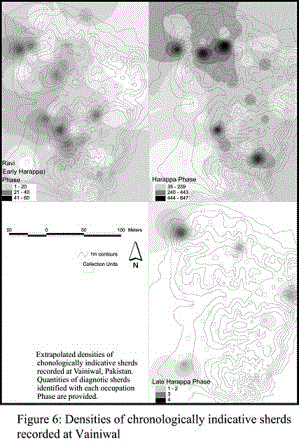
The three maps shown in Figure 6 are based upon quantification of collected data, where the spatial patterns provided a record of relative densities of chronologically sensitive materials. Distributions for 54 of the 71 units are shown. The upper left map shows the density of distribution of Early Harappan (Kot Diji) ceramic sherds. The Harappa phase sherd densities are plotted on the map at the upper right. These spatial distributions indicate that all mounds contained Early Harappan phase ceramics. In the Harappan period sherd densities show intensive occupation of all mounds, with the highest densities located in the central areas of the north mound. Our ongoing studies currently are focused on the illustrations and photographs of ceramics and small finds recorded at Vainiwal and form the basis on which we are breaking down Vainiwal’s chronology into the different phases during Period 3 at Harappa. Also present, but in extremely small quantities are ceramics from Late Harappan phase.
These data indicate that occupation was concentrated on the north and central mounds during the Early Harappan. Expansion and increased occupation in the Harappa phases are represented by the vast quantities of materials from all the sub-phases of occupation at Harappa. It indicates that Vainiwal sustained itself throughout the Harappan period and likely grew in population. The marked drop off in densities in the Late Harappa phase is consistent with the diminished occupation at Harappa during this period, though at both there is a continued occupation.
